Monday 24 March 2014

Using the Kangaroo Plugin


For this diagram we need to use the Kangaroo component with springs as a force object. 

The kangaroo component looks like the one indicated below in the image. A spring force can be added by using the Springs component. 

In this case our input geometry is a line and output geometry is also a line that acts as a spring. The input Rest length in the Springs component is what lets us add a constraint of adjacency.

An other important input is the AnchorPoints in the Kangaroo system. Any number of points can be assigned as Anchor points. Any point assigned as an anchor point lets you move that point in the Rhino interface but also the constraints of rest lengths no longer affect the point assigned as anchor point.

Hence deciding which points can be the anchor points in the bubble diagram is quite critical.

Monday 3 March 2014

The Kangaroo plugin to create the interactive BD ( Bubble Diagram)

To create an interactive BD, the adjacency logic of the bubbles have to be translated to grasshopper. 

The Kangaroo plugin in grasshopper lets you create a spring system. Now imagine if the lines connecting the different circles in the BD were springs of various rest lengths depending on their adjacency. If you pull any circle, it maintains its relationships with its connected neighbors. 

The first step to using a spring system to clearly define the adjacency logic of a BD using a matrix. The image below shows a simple example of a residential matrix. 


We can now define a rest length for the three cases : 


Rest Length - 0 indicates the circumference of the circles stick together. 

Rest Length - 4/ random indicates that there is a line connecting the circles to show the connection but the distance can be randomly arrived at depending on the interaction of the user. 

Rest Length - no connection indicates that there is no lines connecting the circles. 

Using Rhino and Grasshopper to create the BD Algorithm

The first trial to create the BDA (bubble diagram algorithm) was in Rhino and grasshopper. To create a static bubble diagram with circles and lines is convenient using grasshopper and rhino. Even a statically drawn bubble diagram, gives the user the flexibility to change the size and the position of the bubbles at any point of time. Hence reworking is easy.

Below is one of the first trials of creating a basic bubble diagram. It is interesting to note that unlike most algorithms where you can loop to create repetitive patterns, in grasshopper looping works by breaking down components and extracting lists.


The points are drawn in Rhino and hence the points can be moved in the Rhino interface. See below how the bubble diagram can be manipulated in Rhino.


If you are wondering whether text can be added to the bubble diagram - the answer is yes. Text can be added and the size of the text can be changed too. The location of the text can be selected as well, but in this case I have been able to make the text sit only in the centre. I have also not been able to figure out how text can be wrapped in the circles.

The image below shows the addition of text in the bubble diagram.


So to brief it up and to list down the steps to arrive at this bubble diagram :

1 - Draw points in Rhino. These points are the centre of the circles that represents the bubbles of the bubble diagram.

2- In GH ( Grasshopper) assign these points to the points parameter.

3 - In case you want to criss cross lines between all the points  - duplicate the points parameter. Now both the points parameter contain all the points in Rhino.
Use the CrossRef parameter to plug in the points parameter and give the output geometry as a line.

4- To draw the circles, extract the end points of the lines. Collect all the output of start point and end point in a point parameter.

5- Use the CullN to cancel off repeated points and avoid drawing two circle from the same centre point.

6- Extract the list of the points using List Item parameter. Draw circles from the extracted list.

7-  Use the Boundary to create a plane from the circle. Which gives it the red colour.

8- Add the text Tags using  the Tags component.

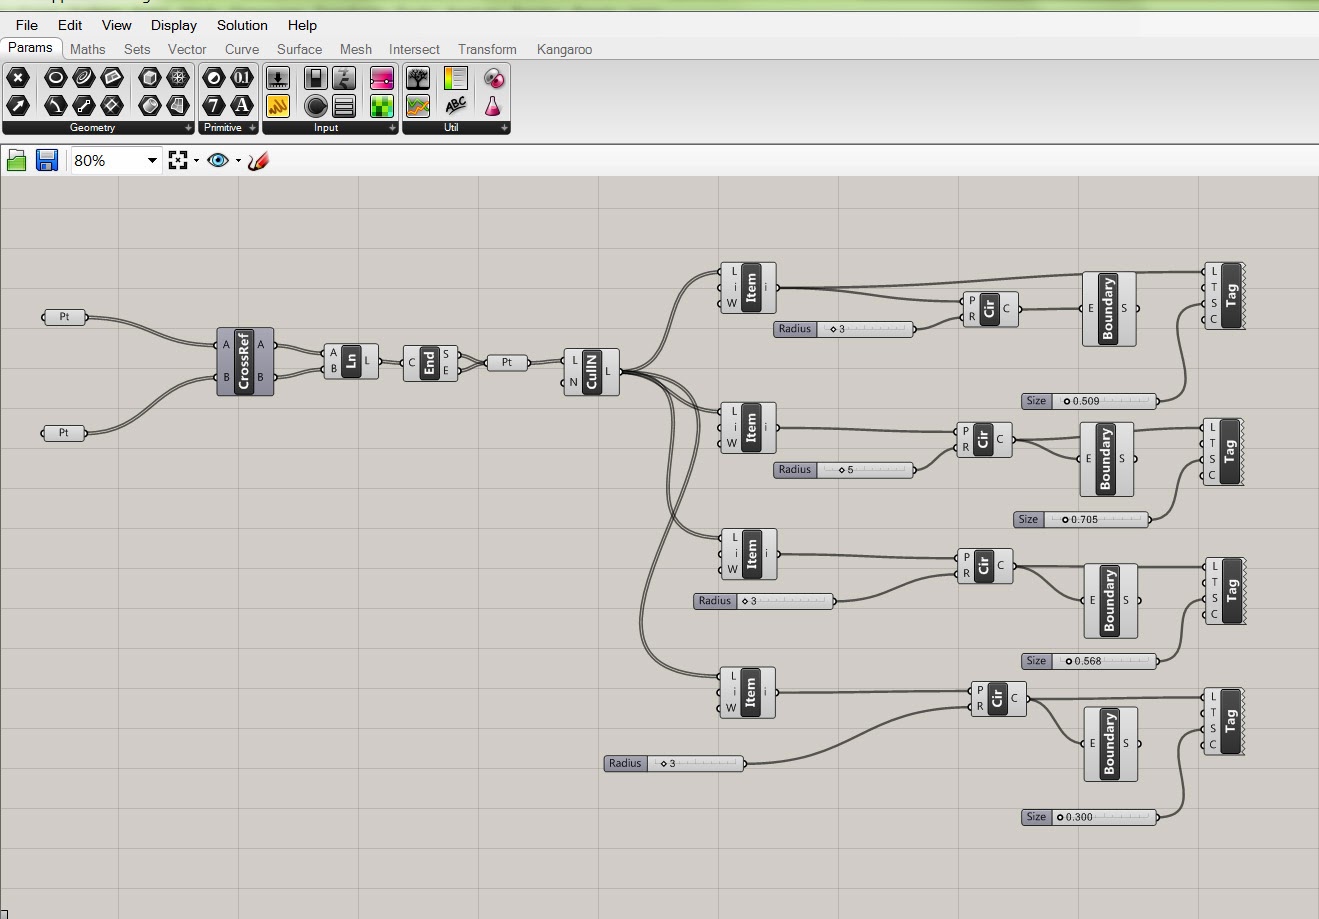
Below is the image showing all the steps in the GH window.


Sunday 2 March 2014

The Bubble Diagram Algorithm

Like mentioned in the previous post, the final 'clean' bubble diagram is a result of reworking and iterations. What if an architect had an interactive bubble diagram, in which he/she could create the bubbles (circles) with approximate areas and apply the adjacency logic. The bubble diagram algorithm aims to create an interactive bubble diagram. 

What is a bubble diagram ?

The bubble diagram is the first ‘diagram’ drawn by the architect to figure out the adjacency of the spaces in a building.

As the name implies, a bubble diagram is essentially bubbles/circles representing the spaces with or without a line connecting these components to display the connection as well as the adjacency of the spaces.

Depending on the complexity of the program in a building, you may have to draw a bubble diagram several times to reach a satisfactory ‘clean’ diagram.


Below is an example of a bubble diagram of a public library. 

Image courtesy:  Changs Holovsky Architects: Salt Spring Island Public Library. June 2009

Another example of a bubble diagram is shown below. This bubble diagram is for an educational institution. Notice how each bubble also represents the approximate size of the space along with the space adjacency. 

Image courtesy: Neufert Architects's data - Third edition